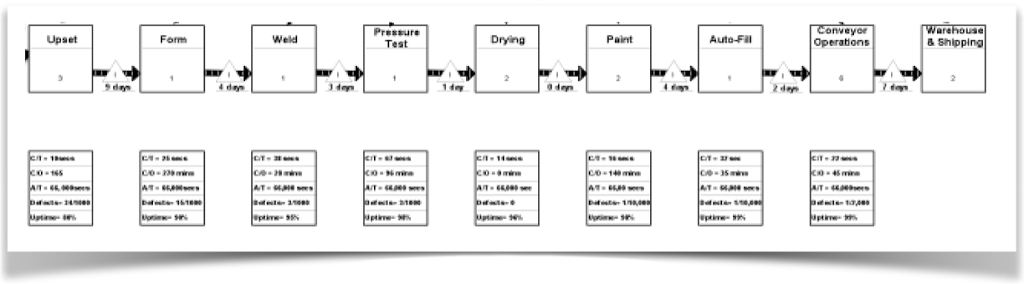
In the picture at the top of the page, you can see both flow chart (discussed in my last post) and the data boxes below them. I’ve included the flow chart in that picture, because the data boxes are linked to specific operations and paint a compelling story of that operation.
So, what is this story the data box tells?
First what goes in a data box needs to be tailored to the value stream being mapped. I’ve used five standard metrics, but they might not work for your business; or, your business may need to add another measure specific to your industry or process.
CT – Cycle time is a critical measure of any operation. It tells us how long it takes to complete one iteration of that process step. It’s important, because, when compared to Takt Time (TT) we learn immediately whether we can meet customer demand. Remember, CT must be less than or equal to TT if we’re to meet our delivery commitments on time.
C/O – Change Over time is the time between making the last good piece of a previous product and the first good piece of the new one. While sometimes referred to as SMED (single minute exchange of die), many industries don’t employ dies. Also, it’s not just about changing a die, but about taking whatever measures are necessary to make the first good part of the new product.
AT – Available Time is the time operators have to actually work each day. It’s the time between when they arrive and when they leave, less any time spent on breaks, lunch, meetings, clean up, etc. As you know, available time is a key component of calculating Takt Time.
Defects – This is pretty self-explanatory. We’re trying to get an idea of how reliable the process at this operational step is.
Uptime – This is the measure of how reliable machines used in that process are. Calculated by subtracting machine down time from 100%, Uptime gives us an idea of where we have problems with equipment. There is a much more comprehensive measure called OEE, and I’ll deal with it in a later post.
CONSIDERATION: When you have multiple machines or multiple operators covered by a single data box, you need to make the decision how you’re going to calculate data values. Some average the values. I believe that creates misconceptions about the process. I elect to post the worst data. You’ll understand why when I later discuss how to use your VSM to determine where to deploy your lean assets.